Native LB Traffic and Monitoring
Beta
The Traffic portal page is an open beta. The functionality is working but we plan to add more features to this section before removing the tag.
V1 LB Required
This section of the portal only works when the V1 load balancer is selected for the given environment.
IDLE Timeout
If a load balancer hasn't received traffic for longer than the period set in idle timeout, the statistics will be reset.
Traffic Dashboard
The traffic dashboard is laid out to allow the user quick looks into their load balancer telemetry by port.
With the appropriate port selected, users get a clear look at several high level metrics including:
Overview
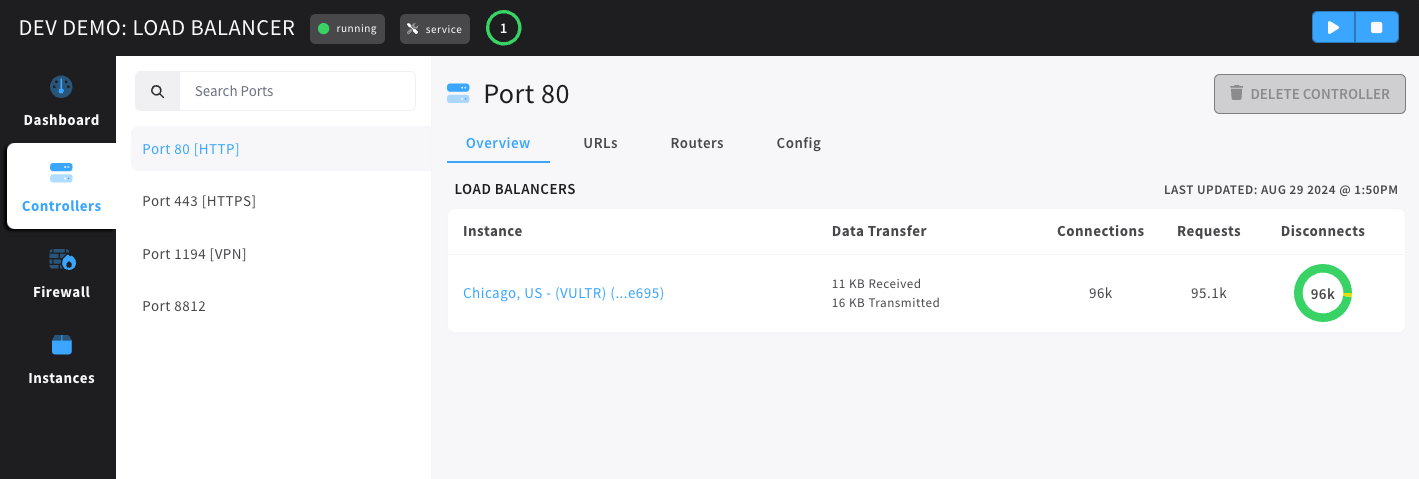
- Instance - The load balancer instance.
- Data Transfer - total amount received and transmitted.
- Connections - total amount of connections made.
- Requests - total number of requests.
- Disconnects - showing the amount of total connections that have ended with and without error.
URL's
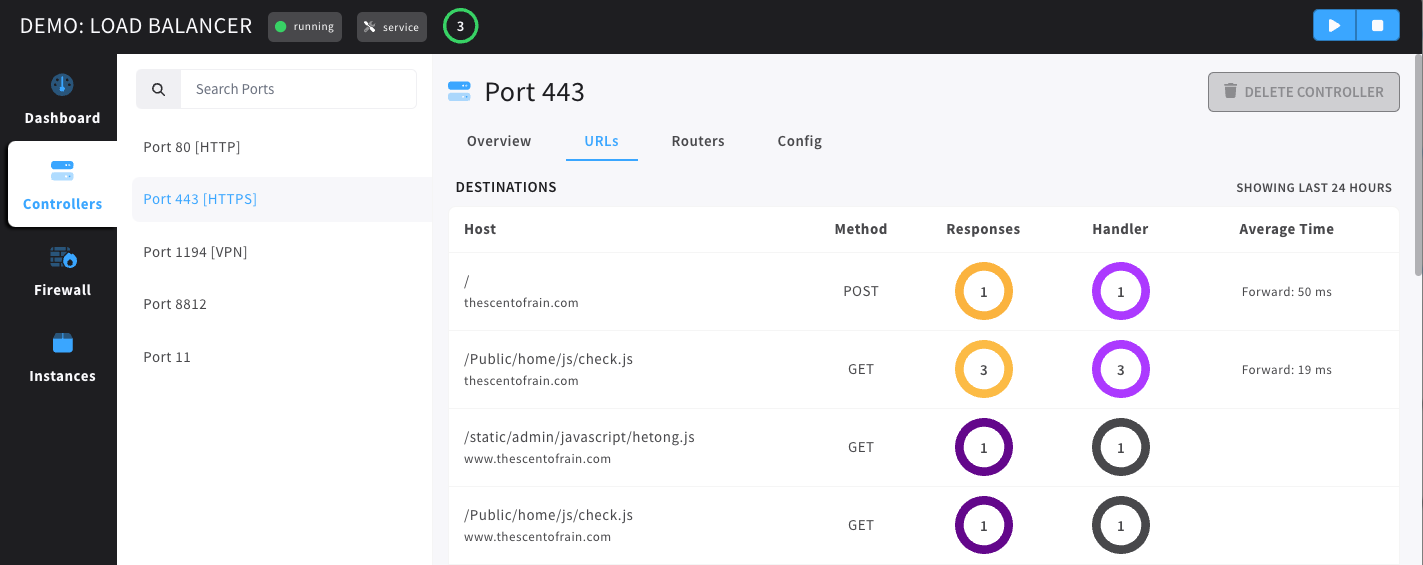
- Host - the domain and path of the incoming call.
- Method - the HTTP method used for the call.
- Responses - the number of responses sent on that domain + path.
- Handler - number(total) and type (graphed) of the handler. Ex in pic is 2 total both forwarded.
- Average Time - the average time to complete the request.
Routers
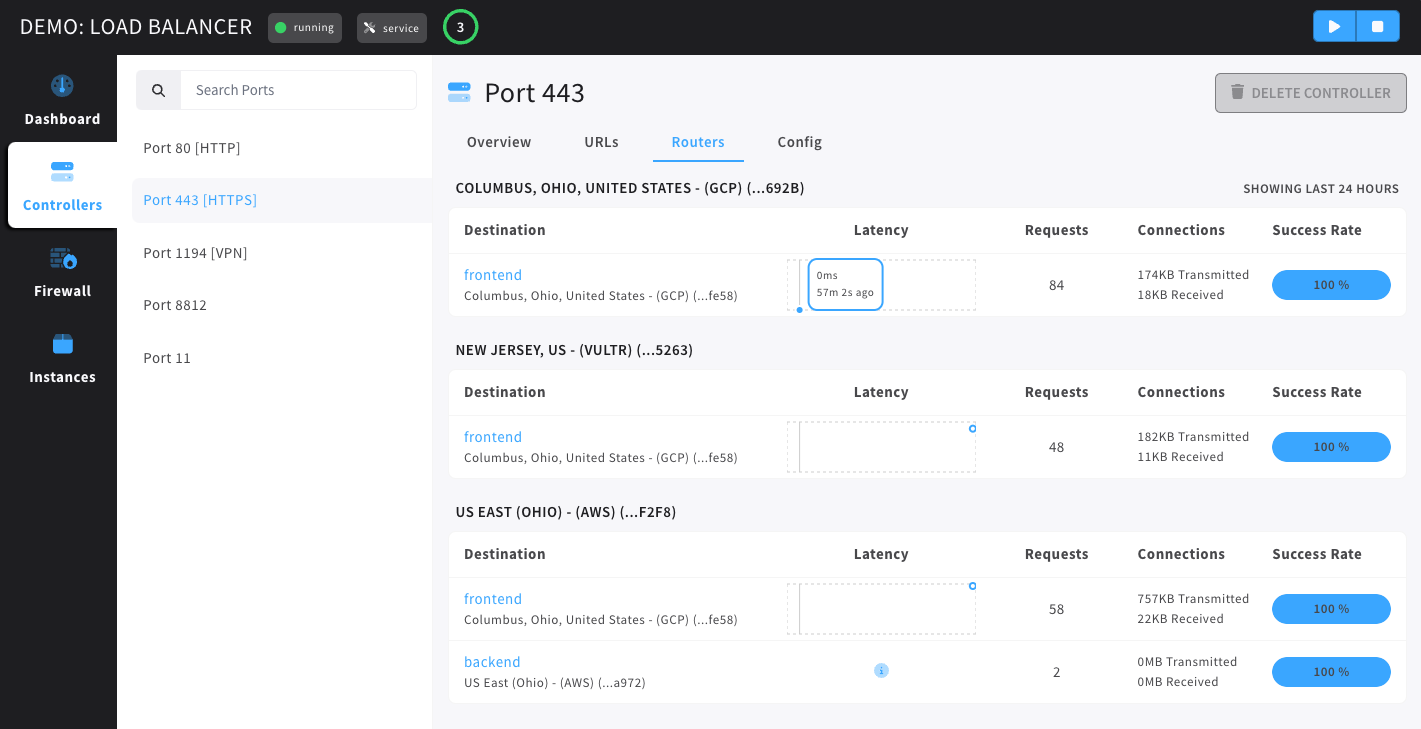
- Destination - container destination for the request.
- Latency - the latency of the connection between lb and destination (measured by ICMP packet).
- Requests - the number of requests (total).
- Connections - amount of traffic transmitted / received.
- Success Rate - amount of times in % that the connection was successful.