Autoscaling
Scaling containers on Cycle is a straight forward process in two parts:
- Container Auto-Scaling
- Infrastructure Auto-Scaling
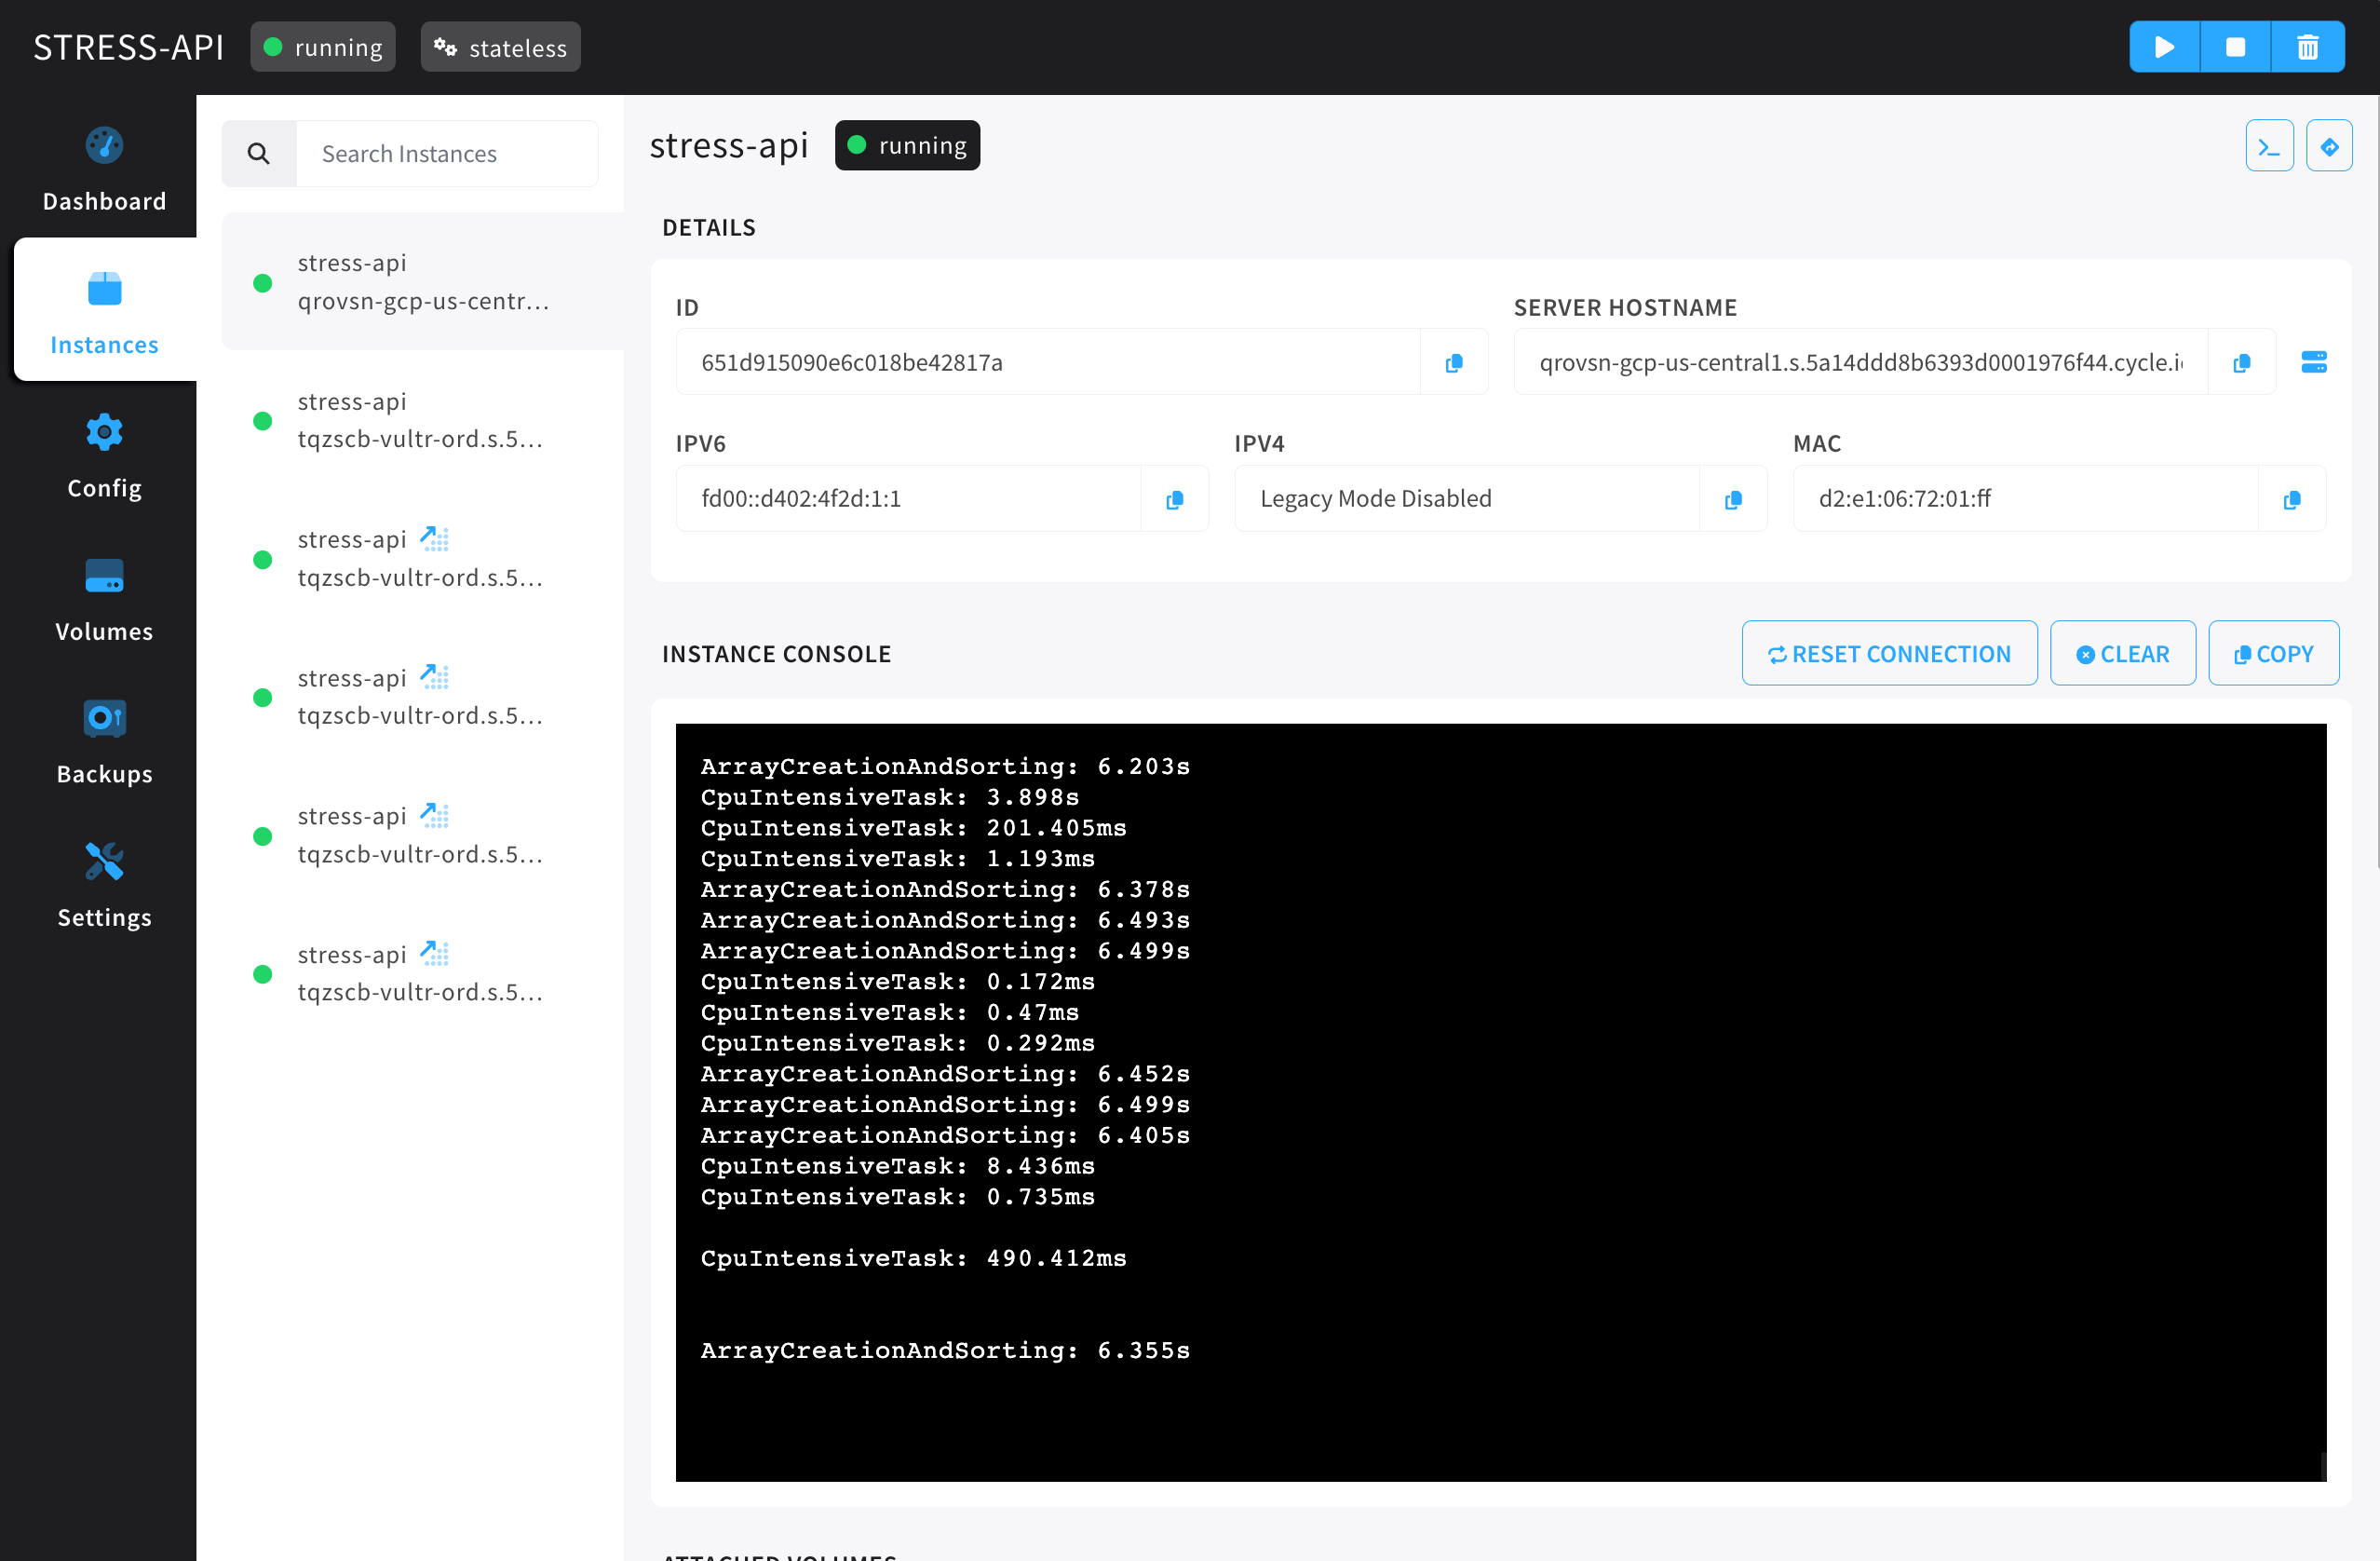
Scaled container instances will have an icon next to them showing they've been created from a scaling event. In the example below, containers instances are being stressed through api endpoints that cause either RAM or CPU usage, with thresholds set on both resources.
Container auto-scaling is a straightforward set of fields that outline what should happen during a scaling event.
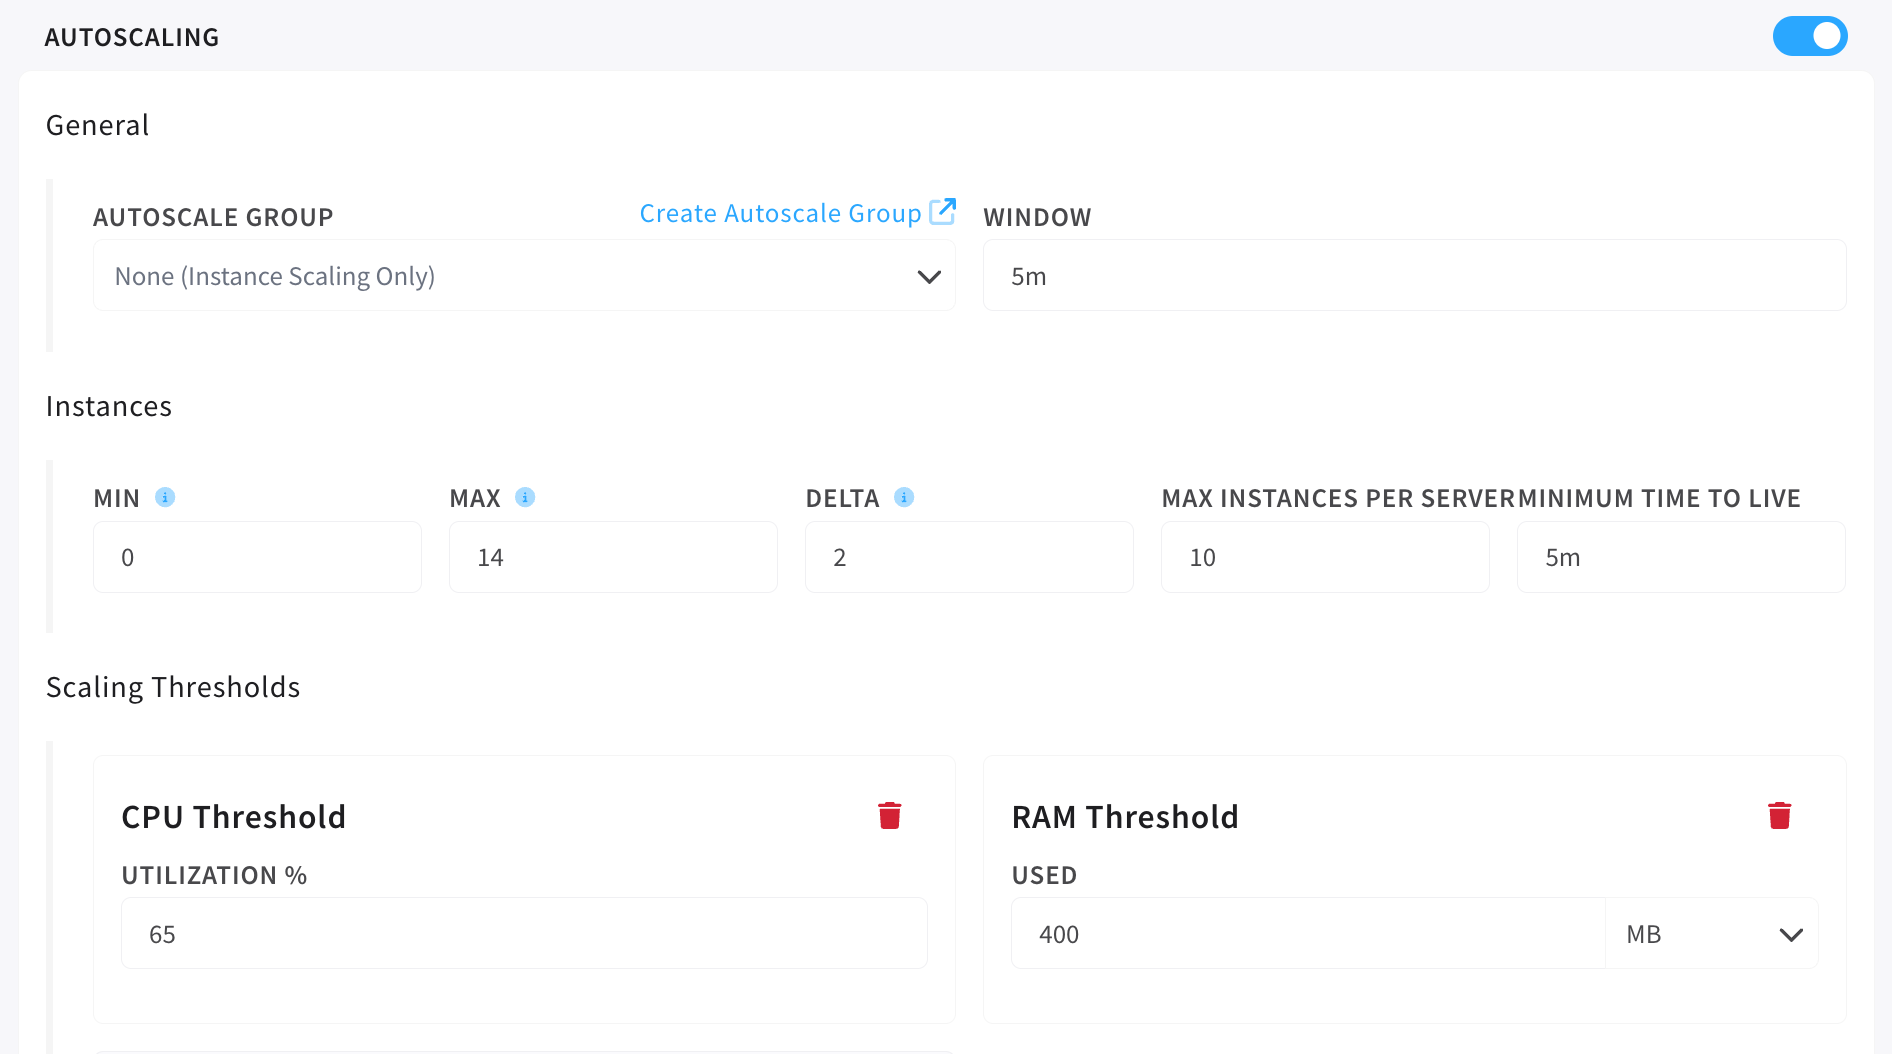
Autoscale Group
This field is set to join a container to a configured auto-scale group.
Window
The window field represents the baseline time-frame for making scaling decisions.
- minimum - 5m
- maximum - 30m
Example: 5m
A 5 minute window means that each time scaling is evaluated, it is evaluated against the average of the previous 5 minutes.
This also means its unlikely that any container will scale between its start time and the configured window time.
Instances
The instances section covers the minimums, maximums, change vectors, and TTL's.
Min
The min setting is how many instances minimum this container should maintain at any given time.
Max
The max setting is how many instances maximum this container can have. A hard ceiling on instances. This setting does not lift as a result of additional infrastructure being deployed, this is the hard limit.
Delta
The delta is how many container should be created as a result of each scaling event.
Max Instances Per Server
The maximum number of instances that can be put on any given qualifying server. This is also a hard limit.
Minimum Time to Live
The minimum amount of time a scaled instance can exist before being subject to a scale down event.
Thresholds
Thresholds are the settings from which the scaling event decision is derived.
Example CPU Utilization 50%
If any instance of the container is, on average (defined by the average over the time of the window), using more than 50% of the alloted CPU available to it... A scaling event will occur.
CPU Threshold
CPU threshold is measured by utilization. Utilization is measured by taking current CPU limit / current CPU usage. A display of this value for each instance is shown on the individual instances' dashboard as a percentage.
RAM Threshold
RAM threshold is measured by actual usage of RAM. The threshold can be set based on the amount of RAM used, but the amount used when calculating the need for a scale event is still the average over the "window'd" period.
Network Throughput
The network throughput threshold is based on how much traffic is received (as measured in bandwidth) over a given veth interface. There is a private checkbox that
when checked will measure traffic over eth-priv, unchecked measures traffic over eth-pub.